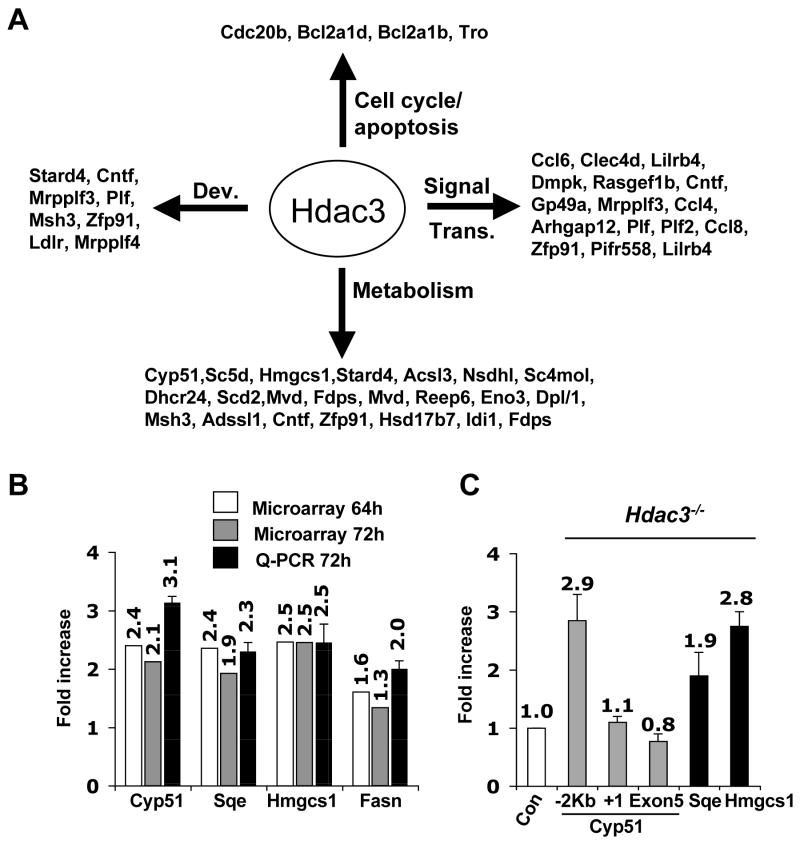
Figure 2. Inactivation of Hdac3 affects gene expression.
(A) Classification of genes that were up- regulated at least 1.5-fold in both tamoxifen-treated Hdac3FL/− ERCre+ and in Ad-Cre treated Hdac3FL/−MEF at the 72hr time point. The data were analyzed using Gene Spring software to obtain the gene list and then these genes were categorized based on their different biological functions such as development (Dev.), signal transduction (Signal Trans.), cell cycle, and metabolism, using the Panther Gene Classification software. (B) Total RNA was isolated 72 hr after addition of tamoxifen to Cre-ER containing MEFs and real time PCR (Q-PCR) analysis was performed to validate the genes that were up regulated in both Ad-Cre and tamoxifen (64hr and 72hr) treated MEFs. Real time PCR was done in duplicate with the RNA isolate that was used for the microarray and with a different isolate of RNA (biological replicate) obtained from tamoxifen- and ethanol-treated Hdac3FL/−/ERCre+ MEFs. The values represent the average fold-increase ± S.E. of duplicate samples. (C) MEFs (Hdac3 FL/+ and Hdac3 FL/−) were infected with Ad-Cre and ChIP analysis was performed 50hr post infection and the data was quantified by real-time PCR analysis. The level of acetylated histone H3 obtained in uninfected and infected samples was normalized to the total histone H3 occupancy. The fold-increase in the acetylated H3 level was then calculated for the Ad-Cre infected Hdac3FL/− and Hdac3FL/+ MEFs after normalization to the values obtained from the uninfected cells as the control. The relative fold-increase in Ad-Cre infected Hdac3FL/− MEFs, denoted as Hdac3−/− in the figure, was calculated by normalizing the values to those obtained from infected Hdac3FL/+ MEFs denoted as Con. For Cyp51, primers 2 Kbp upstream of the transcriptional start site, at the transcriptional start site, and in Exon 5 were used. The data shown are the average fold-increase ± S.E. obtained from two different MEF preparations, each done in duplicate.

