
Figure 3. Examination of H3Ser10 phosphorylation in Hdac3−/− MEFs and restoration of H3Ser10 phosphorylation by caffeine treatment in Hdac3−/− NIH 3T3 cells.
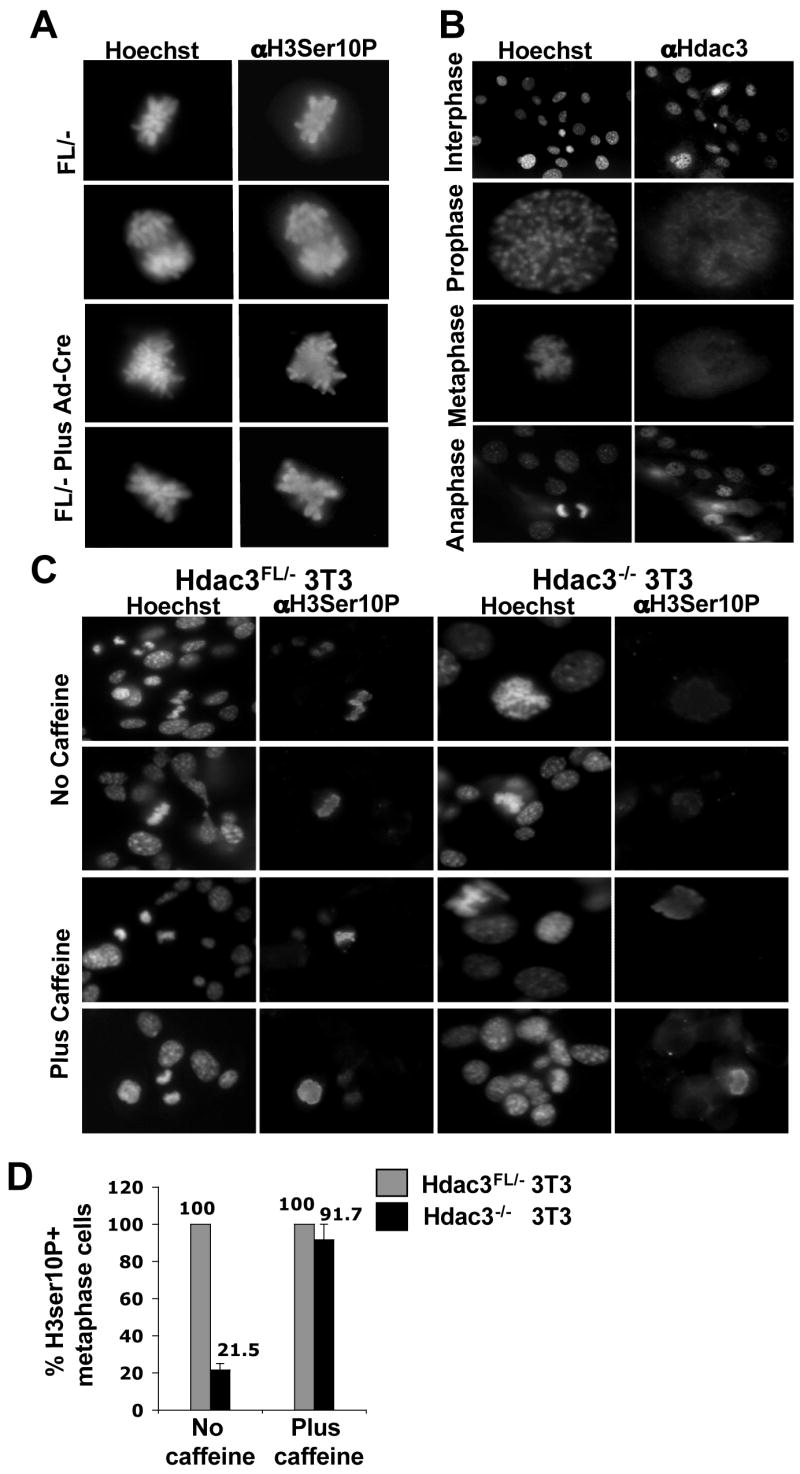
(A) Immunofluorescence analysis of mock infected or Ad-Cre infected Hdac3FL/−MEFs using anti-phospho-H3Ser10 at 90hr post-infection. Cells were stained with Hoechst 33258 to visualize the nucleus. (B) Immunofluorescence analysis using anti-Hdac3 shows the localization of Hdac3 with chromatin in interphase and prophase stages of the cell cycle. The wild type MEFs were counterstained with Hoechst 33258 to visualize the DNA. (C) Caffeine restores histone H3Ser10 phosphorylation in Hdac3−/−NIH 3T3 cells. Immunofluoresence staining of untreated and caffeine-treated cells using anti-phospho H3Ser10 on Hdac3FL/− and Hdac3−/− NIH 3T3 cells. Cells were treated with 2mM caffeine for 30 min prior to fixation. Hoechst staining of the cells was performed to visualize the nucleus. Two independent experiments were performed and the images shown are from a representative experiment. (D) Quantification of Phospho-H3Ser10 positive metaphase cells in Hdac3FL/− and Hdac3−/− NIH 3T3 cells in the absence and presence of caffeine. The values represent average percentage ± S.E. obtained from two independent experiments.