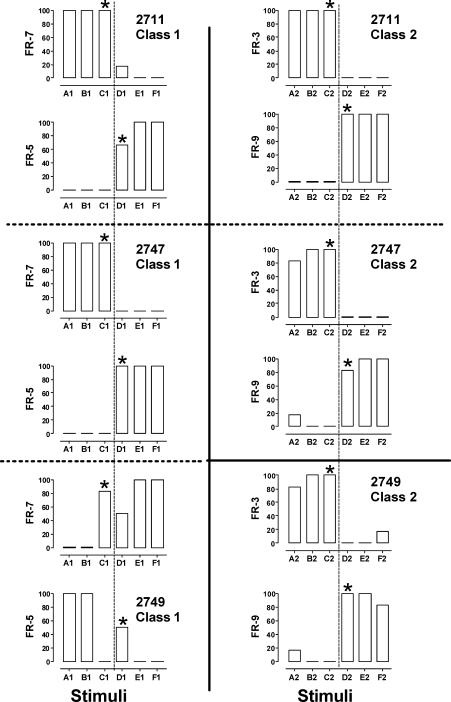
Fig 6.
Relative frequencies of responding in the presence of the A through F stimuli in each class during the last three of four test blocks conducted during the dual-option response transfer test. The figures in each row are for one subject. The figures in the left and right columns are for equivalence classes 1 and 2, respectively. Each of the six sectors in the figure contains two panels. The upper panel in each sector shows the generalization of the response trained to the C stimulus in a 6-member class. The lower panel in each sector shows the generalization of the response trained to the D stimulus in a 6-member class. Asterisks indicate the C and D stimuli that were used as SDs during dual-option discrimination training.

