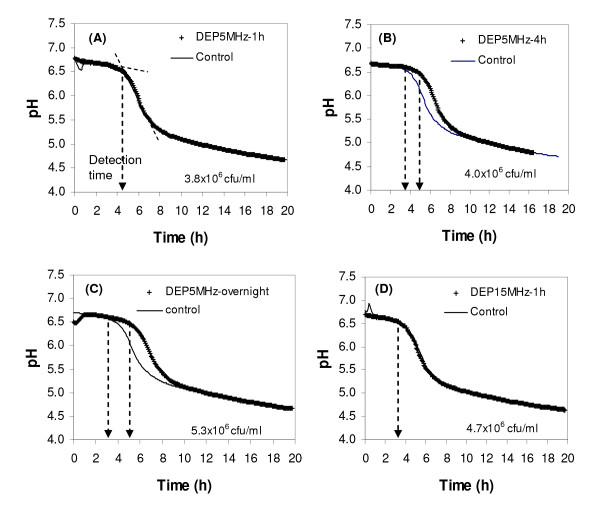
Figure 5.
The growth profiles of DEP-treated Listeria monocytogenes in LCGM medium monitored by real time pH measurements, along with control samples. The DEP treatment conditions and initial cell numbers in the samples are shown in each plot. DEP voltages for all samples were at 20 Vpp. Arrows indicate the detection times on pH-growth curves.

