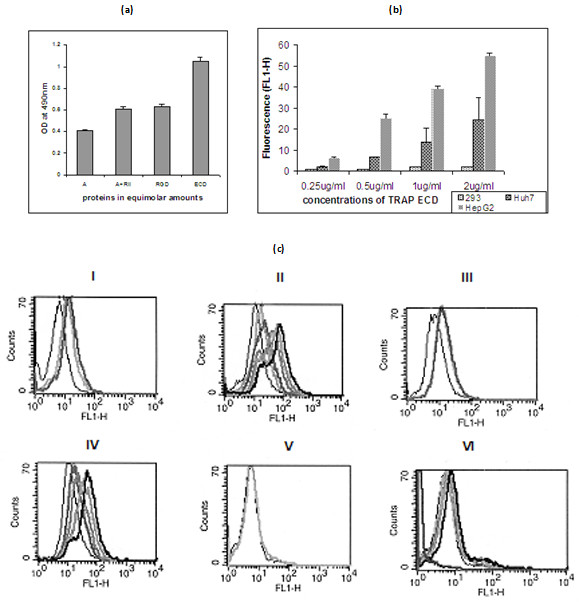
Figure 2.

(a). Binding of TRAP A domain, A+RII domain and ECD to HepG2 cells. HepG2 cells (approx. 1 × 10⁵) cells were seeded in 96 well cell culture plates and incubated with PfTRAP fragments in equimolar amounts. Binding was evaluated through ELISA. Results are the mean ± SD of n = 3 experiments. (b). Binding specificity of PfTRAP ECD with hepatoma cell lines. HEK 293 (Kidney cell line), Huh-7 and HepG2 (hepatoma cell lines) cells were incubated with biotinylated PfTRAP ECD. Binding was evaluated through a flow cytometry analysis using Streptavidin-PE. Results are the mean ± SD of n = 3. (c) (i, iii and v) Control FACS data with unstained (black), stained (light grey) and Biotinylated BSA (dark grey) using HepG2 cells, Huh-7 cells and HEK 293 kidney cell lines respectively. (ii, iv and vi) FACS data to evaluate binding of PfTRAP ECD to HepG2 cells, Huh-7 cells and HEK 293 cell lines respectively with the increasing amounts of PfTRAP ECD (grey to thick black) (0.25, 0.5, 1.0 and 2.0 μg) and the stained cells control (thin black).
