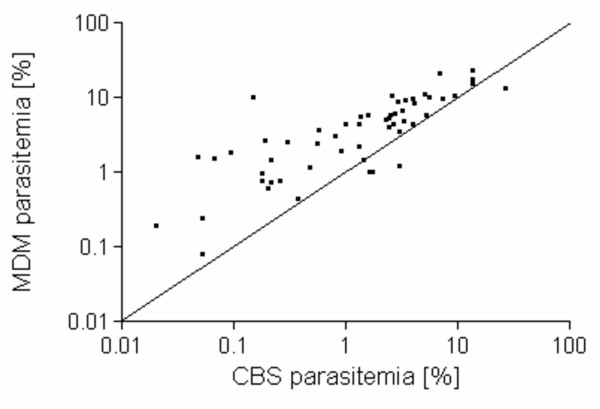
Figure 2.
Comparison of paired CBS and MDM results from P. falciparum-infected study participants. MDM parasitaemia (Y-axis) is compared to CBS parasitaemia (X-axis) for paired of analysis of 55 P. falciparum-infected blood samples. The line bisecting the graph identifies where points would fall if identical results were observed between the two diagnostic methods (IS, MDM > 1).

