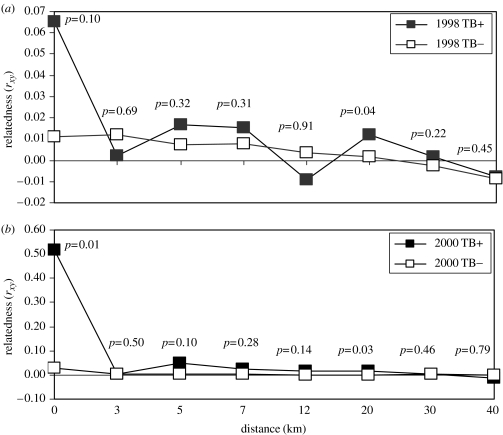
Figure 1.
Mean relatedness (rxy; Queller & Goodnight 1989) among TB-infected (filled squares) and non-infected (open squares) white-tailed deer separated by increasing distance prior to (a) (1998) and following (b) (2000) efforts to reduce deer density and ban feeding (note scales on y-axes). p-values indicate the proportion of times mean relatedness among 5000 random samples of non-infected deer was higher than among TB-infected deer.

