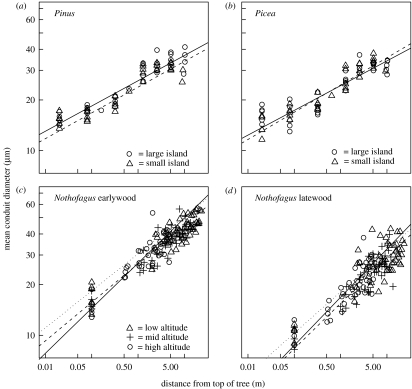
Figure 2.
The relationship between the distance from the treetop (H, m) and the mean hydraulically weighted conduit diameter (C, μm) for three species: (a) Pinus sylvestris, (b) Picea abies, (c) and (d) Nothofagus solandri. The lines are the SMA regression lines for the trees on large (open circles) and small (open up triangles) islands in (a) and (b) and low- (open up triangles), mid- (plus) and high-altitude trees (open circles) in (c) and (d).

