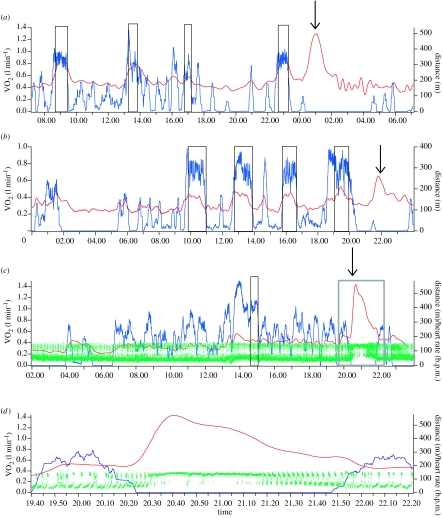
Figure 1.
Examples of ERMEs (down arrows). Traces (a–c) are representative periods from different trials; the section of trace (c) indicated by the grey box is magnified in trace (d). Each trace shows the 20 min moving average of VO2 (red) and the 20 min summed distance travelled (blue). Black rectangles indicate periods of foraging and feeding. The green shades on traces (c) and (d) are the instantaneous heart rate (heart rate was not measured during the trials shown in traces (a) and (b)).

