Figure 3.
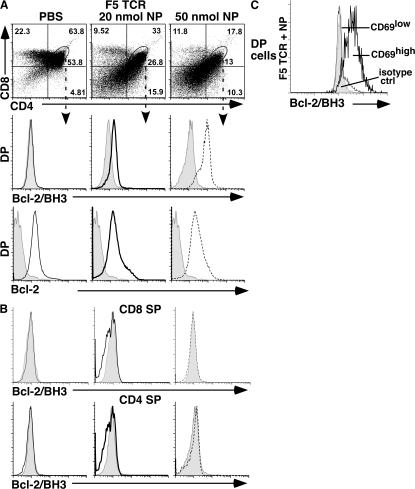
Flow cytometric analysis of CD4, CD8, Bcl-2/BH3, and Bcl-2 staining of thymocytes from F5 TCR transgenic mice. (A) Bcl-2/BH3 and Bcl-2 expression of DP cells from F5 TCR transgenic mice 15 h after injection of PBS or 20 or 50 nmol of nucleocapsid peptide. Here, the shaded area represents isotype control, solid lines represent DP cells from PBS-injected mice, thick solid lines represent DP cells from mice injected with 20 nmol NP peptide, and dotted lines represent DP cells from mice injected with 50 nmol NP peptide. (B) Bcl-2/BH3 exposure was not observed in DN and SP cells from F5 TCR transgenic mice after injection of PBS or 20 or 50 nmol of nucleocapsid peptide. (C) Bcl-2/BH3 expression on CD69high and CD69low DP cells from a F5 TCR transgenic animal 10 h after injection with 50 nmol NP peptide. Here, the shaded area represents isotype control, the solid line represents CD69low DP cells, and the thick solid line represents CD69high DP cells. Five independent experiments have been done with similar results. All staining of F5 TCR transgenic mice is on Vβ11+ thymocytes.

