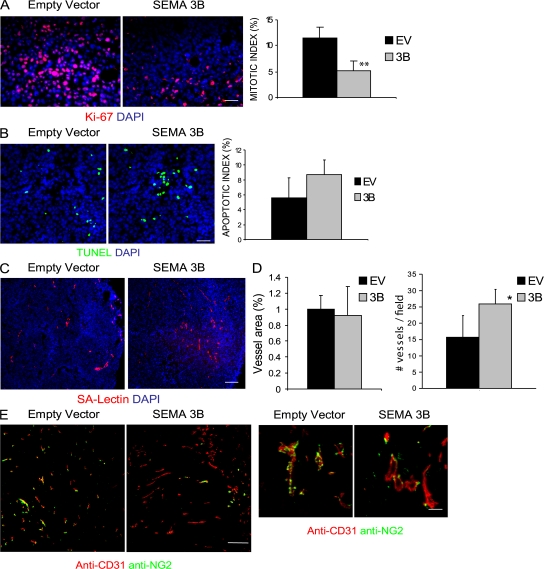
Figure 3.
Tumor cell proliferation and angiogenesis in SEMA3B-expressing tumors. (A) Control or SEMA3B-expressing tumors (15 d after transplant) were immunostained to reveal KI-67 proliferation markers (red), whereas nuclei were visualized by DAPI (blue). Representative fields are shown. Bar, 20 μm. The bar graph shows the percentage of Ki-67–positive cells (mean ± SD) in six tumors per each experimental group. For all quantifications shown in this figure, at least three sections and 10 fields were counted for each tumor. **, P < 0.01. (B) Tumor sections were analyzed to reveal apoptotic cells using TUNEL green kit. Micrographs show representative fields. Bars, 20 μm. The bar graph indicates the percentage of TUNEL-positive cells (mean ± SD) in six tumors per each experimental group. (C) Micrographs show sections from tumors stained with SA-lectin to reveal endothelial cells (red), whereas nuclei were marked with DAPI (blue). Bar, 60 μm. (D) Quantification of the results in C. The graphs indicate the percent area occupied by vessels (left) or the vessel number (right), calculated in six fields per section. Values represent the mean ± SD from six tumors per each experimental group. *, P < 0.05. (E) Sections from tumors excised at day 21 after transplant were immunostained with anti-CD31 (red) and with an antibody revealing the chondroitin proteoglycan NG2 that is expressed on pericytes (green). Micrographs show representative fields at low and high magnifications (left and right, respectively). Bars: (left) 60 μm; (right) 20 μm.

