Figure 7.
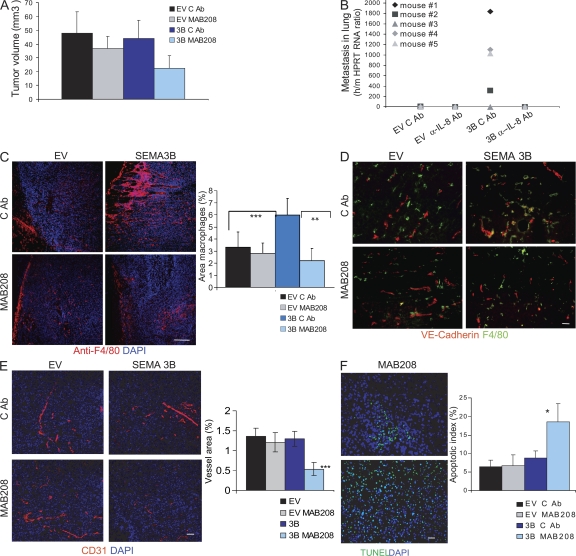
Neutralizing IL-8 in SEMA3B-expressing tumors blocks macrophage recruitment and metastasis. (A) Nude mice were injected subcutaneously with either MDA-EV or MDA-3B tumor cells together with 100 μg of neutralizing IL-8 antibody (MAB208) or 100 μg of control antibody (anti-CD19). Antibodies were administered locally into tumors again at days 2, 5, 8, and 11 after tumor transplant. Data shown are the mean tumor volume ± SD from 10 tumors per each experimental group at the day of excision (day 15). (B) To reveal metastatic dissemination from the tumors, the lungs of mice described in A were analyzed by real-time RT-PCR using species-specific Taqman probes for mouse HPRT and human HPRT transcripts. Plotted values indicate the mean ratio between human and mouse RNA levels in the lungs of five mice per each experimental group ± SD. *, P < 0.05. (C) Tissue sections from SEMA3B and EV tumors, treated with control antibody or MAB208 (from the same experiment as in A), were stained with anti-F4/80 to detect monocytes/macrophages (red), whereas nuclei were revealed with DAPI (blue). Bar, 60 μm. Each data point represents the mean percentage of the macrophage-occupied area ± SD from eight tumors per each experimental group (10 fields were counted from at least three different sections for each tumor). **, P < 0.01; ***, P < 0.001. (D) Blood vessels and macrophages in sections of MDA-EV or MDA-3B tumors treated as described were revealed with anti–VE-cadherin (red) and anti-F4/80 (green); nuclei were marked with DAPI. Bar, 60 μm. (E) Blood vessels in sections of MDA-EV or MDA-3B tumors treated as described were revealed with anti-CD31 antibody (red), whereas nuclei were marked by DAPI (blue). Bar, 60 μm. The graph shows the mean vessel area ± SD from eight tumors for each experimental group (at least three sections and 10 fields were quantified per tumor). ***, P < 0.0005. (F) Sections from MDA-EV or MDA-3B tumors treated as described were subjected to TUNEL staining to reveal apoptotic cells. Bar, 60 μm. The graph shows the mean percentage of TUNEL-positive cells (±SEM) from five tumors for each experimental group in at least three sections and 10 fields. *, P < 0.05.

