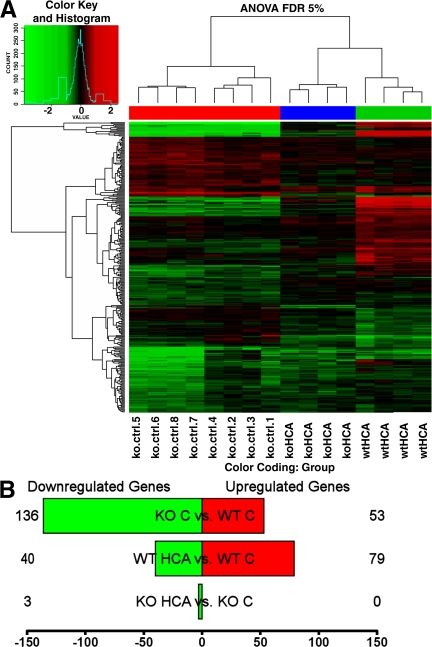
Figure 3.
Gene expression array analysis of ATF4+/+ and ATF4−/− neurons before and after treatment with HCA. (A) Heatmap with cluster dendrogram of the differentially expressed genes (log2 fold change vs. control) at a false discovery rate of 5%. Unsupervised clustering groups samples by genotype and by treatment. Genes are in rows and samples are in columns. Column color coding is as follows: red, ATF4−/− versus ATF4+/+ untreated neurons; blue, HCA-treated ATF4−/− versus untreated ATF4−/− neurons; and green, HCA-treated ATF4+/+ versus untreated ATF4+/+ neurons. (B) The number of genes that are up- (red) and down-regulated (green). Shown are three different contrasts: ATF4−/− versus ATF4+/+ untreated neurons, HCA-treated ATF4+/+ versus untreated ATF4+/+ neurons, and HCA-treated ATF4−/− versus untreated ATF4−/− neurons. The complete list of differentially expressed genes is available in Table S3 (available at http://www.jem.org/cgi/content/full/jem.20071460/DC1). ANOVA FDR, analysis of variance false discovery rate; C, control.

