Figure 6.
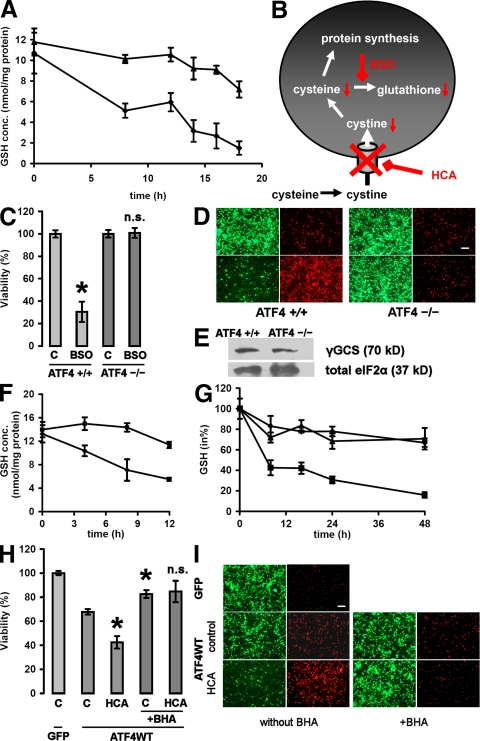
ATF4 has a negative impact on the neuronal glutathione metabolism. (A) ATF4+/+ (♦) and ATF4−/− (▴) cortical neurons were treated with 10 mM HCA. At the indicated time points, cells were trypsinized, washed, and pelleted. Reduced glutathione (GSH) was determined in the cell pellets using HPLC electrochemical detection. Data are from three separate cultures, and each data point was measured in duplicate. Graph depicts mean ± SD. (B) Schematic overview over cysteine uptake and glutathione synthesis and their inhibition. (C) ATF4+/+ and ATF4−/− cortical neurons were treated with a vehicle control (shown as C) or 200 μM BSO. 24 h later, cell viability was determined using the MTT assay. The graph depicts mean (compared with control) ± SD calculated from five separate experiments for each group (n = 46 ATF4+/+ and 58 ATF4−/−). *, P < 0.05 from untreated ATF4+/+ cultures by the Kruskal-Wallis test followed by Dunn's multiple comparisons test. The difference between treated and untreated ATF4−/− neurons was not significant (n.s.). (D) Live/dead assay displaying untreated and BSO-treated ATF4+/+ and ATF4−/− neurons. Bar, 50 μm. (E) Protein expression of γ-GCS does not differ between ATF4+/+ and ATF4−/− cortical neurons. Cytoplasmic extracts were separated using gel electrophoresis and immunodetected using an antibody against γ-GCS. Total eIF2α was monitored as a loading control. (F) ATF4+/+ (♦) and ATF4−/− (▪) cortical neurons were treated with 200 μM BSO. At the indicated time points, cells were trypsinized, washed, and pelleted. GSH was determined in the cell pellets using HPLC electrochemical detection. Data are from three separate cultures, and each data point was measured in duplicate. Graph depicts mean ± SD. (G) ATF4+/+ cortical neurons were infected with GFP (♦), ATF4WT (▪), and ATF4ΔRK (▴) adenoviruses at an MOI of 100. At the indicated time points after infection, cells were trypsinized, washed, and pelleted. GSH was determined in the cell pellets using HPLC electrochemical detection. The graph depicts mean ± SD calculated from three separate experiments for each group, and each data point was measured in duplicate. The value obtained from noninfected neurons was arbitrarily defined as 100%. (H) ATF4+/+ cortical neurons were infected with GFP and ATF4WT adenoviruses at an MOI of 100. 24 h after infection, neurons were treated with vehicle control (shown as C), 10 mM HCA, 10 μM BHA, or a combination of both. The graph depicts mean (compared with control) ± SD calculated from five separate experiments for each group (n = 29). *, P < 0.05 from untreated neurons overexpressing ATF4WT by the Kruskal-Wallis test followed by Dunn's multiple comparisons test. The difference between neurons overexpressing ATF4WT treated with BHA alone and neurons overexpressing ATF4WT treated with both BHA and HCA was not significant (n.s.). (I) Live/dead assay. Bar, 50 μm.

