Figure 7.
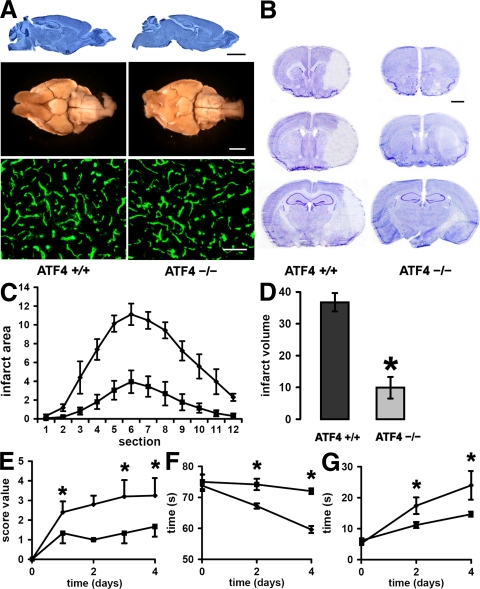
Role of ATF4 in brain ischemia. (A, top) Sagittal sections of ATF4+/+ (left) and ATF4−/− (right) brains stained with cresyl violet. Bar, 3,000 μm. (A, middle) Ventral view of large cerebral blood vessels of representative ATF4+/+ (left) and ATF4−/− (right) mice that were perfused with India ink. Note the higher degree of tortuosity of the MCA in the brain from the ATF4−/− mouse. Bar, 3,000 μm. (A, bottom) Representative microscopic views of brain sections from ATF4+/+ and ATF4−/− mice that were immunostained for the endothelial cell–specific marker CD31 (green). Bar, 100 μm. (B) Representative brain sections at 4 d after MCAo from ATF4+/+ (n = 5) and ATF4−/− (n = 6) mice from rostral to caudal stained with cresyl violet to determine the infarct area. Bar, 1,000 μm. (C) The infarct area in ATF4+/+ (♦) and ATF4−/− (▪) brains was measured in 12 sequential sections taken from ATF4+/+ (n = 5) and ATF4−/− (n = 6) mice at rostral to caudal regular intervals. Graph depicts mean ± SD. (D) The infarct volume was assessed by adding the infarct volumes based on the infarct area in each section. Graph depicts mean ± SD. *, P < 0.0001 by the t test. (E) Scoring of neurological deficit was assessed at different time points of recovery in ATF4+/+ (n = 5) and ATF4−/− (n = 4) mice. Graph depicts mean ± SD. *, P < 0.05 by the Mann-Whitney test. (F) Inclined plane test at different time points after stroke in ATF4+/+ (n = 5) and ATF4−/− (n = 4) mice. The test measured the time a mouse managed to hold itself on an inclined glass plate angled at 50° before sliding down. Graph depicts mean ± SD. *, P < 0.05 by the t test. (G) Hanging wire test at different time points after stroke in ATF4+/+ (n = 5) and ATF4−/− (n = 4) mice. The hanging wire test determined the time it took an animal to cross a distance of 45 cm on a freely hanging narrow metal bar. Graph depicts mean ± SD. *, P < 0.05 by the t test.

