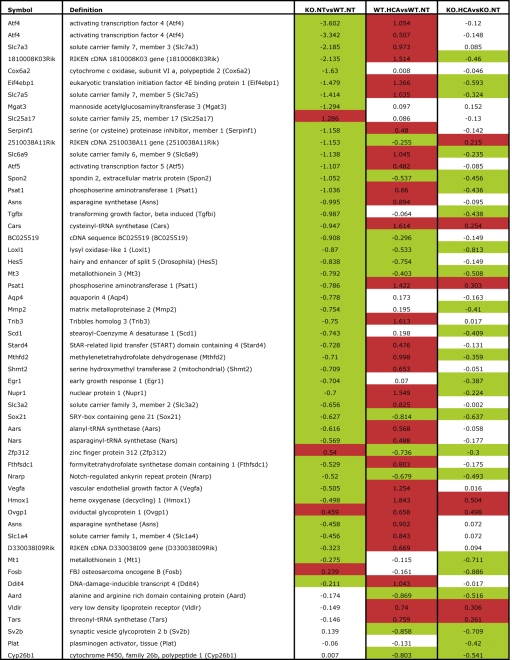
Table I.
Differentially expressed genes in ATF4−/− neurons versus ATF4+/+ neurons before and after HCA treatment
From each of the three contrasts, the top 30 genes with the highest fold change were selected. Ratios are log2 transformed. Up-regulated genes (fold change > 0.2) are highlighted in red, and down-regulated genes (fold change < −0.2) are highlighted in green.

