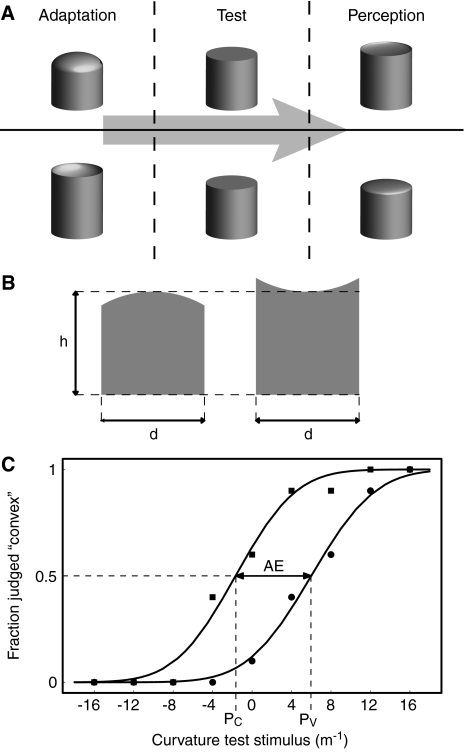
Fig. 1.
a Schematic overview of a haptic curvature aftereffect: when you first touch a convex (concave) surface for some time, say 10 s, and subsequently touch a flat surface, this latter surface feels concave (convex). b Schematic drawings of the cross-sections of a convex and a concave stimulus. The stimuli had a cylindrical shape with a spherical top (see illustration a). The distance from the bottom to the centre of the top (h) was consistently 30 mm. The diameter of the cylinders (d) was also 30 mm. c Examples of two psychometric curves. The circular data points and the fit through these points results from adaptation to the convex adaptation stimulus. The PSE is represented by PV. The square data points and the fit through these points result from adaptation to the concave adaptation stimulus. In this case, the PSE is represented by PC. The magnitude of the aftereffect (AE) is defined as the difference between PV and PC

