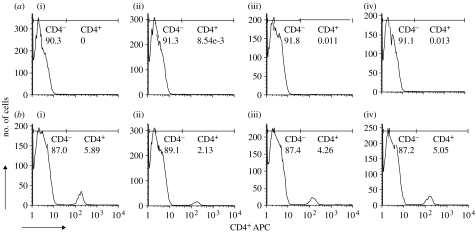
Figure 1.
FACS plots of number of cells analysed and percentage of CD4+T cells in (a) CD4+T cell-depleted and (b) intact control mice. Percentage of the CD4+T cells was analysed: (i) 1 day before parasite challenge and (ii–iv) once a week throughout the experiment. Each graph is a representative of one mouse from either the CD4+T cell-depleted or immunocompetent control group.

