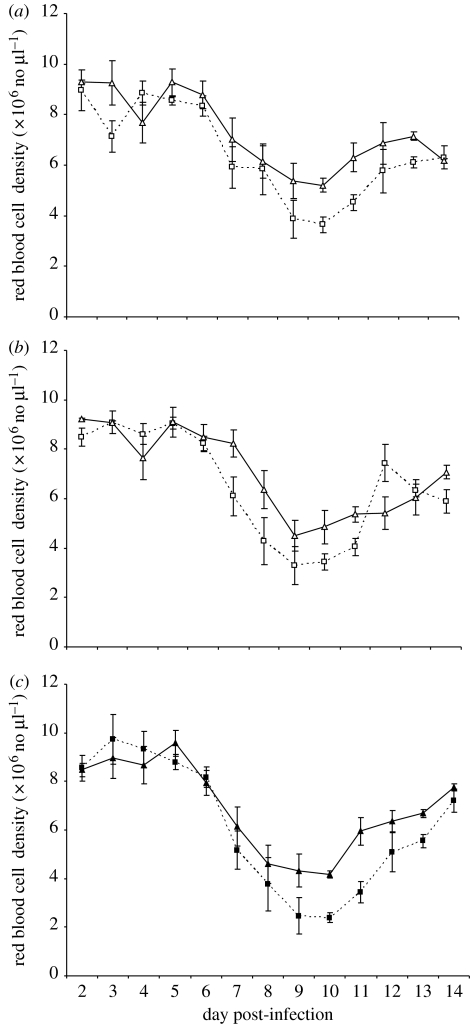
Figure 3.
Mean red blood cell densities (±1 s.e.m) over time. (a) CD4+T cell-depleted and intact mice infected with DK (squares, depleted single; triangles, intact single), (b) depleted and intact mice infected with AS (squares, depleted single; triangles, intact single), and (c) depleted and intact mice infected with DK and AS (squares, depleted mixed; triangles, intact mixed).

