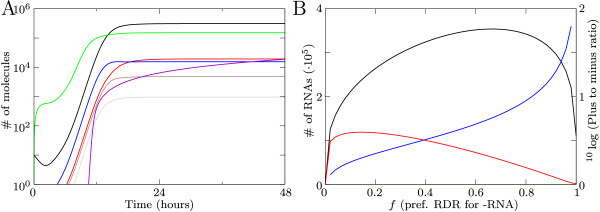
Figure 2.
Viral growth in a silencing deficient system. (A) Timeseries of virus growth showing the number plus-strand RNA (black); minus-strand RNA (red); free RDR (green); dsRNA complex from plus strand (gray), dsRNA complex from minus strand (brown); RDRs active on minus strands (blue); and the number of virions (violet). (B) The effect of f on the number of plus and minus strands, with plus-strand RNA (black) and minus-strand RNA (red). The blue line shows the effect on the plus-to-minus strand ratio.

