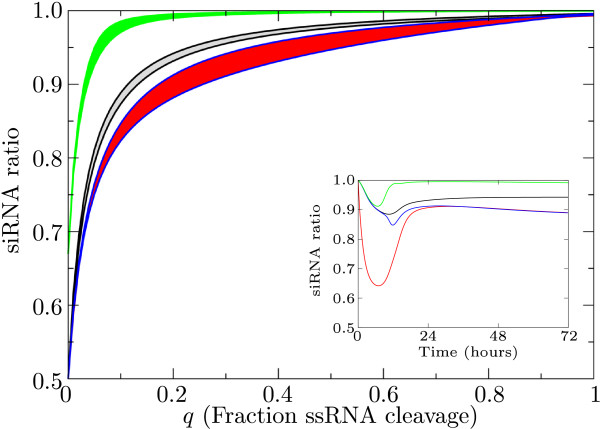
Figure 6.
siRNA ratios. siRNA ratios observed for varying Dicer cleavage modes: on the left Dicer cleaves exclusively dsRNA; on the right exclusively ssRNA. Shown are siRNA ratios for the primary pathway (black); primed amplification (green), unprimed amplification (red) and guided amplification (blue). Unprimed and guided amplification result in the same siRNA ratios, the lines lie on top of each other. The inset shows the change in siRNA ratio in time for all studied pathways (fraction of ssRNA cleavage q is 0.2).

