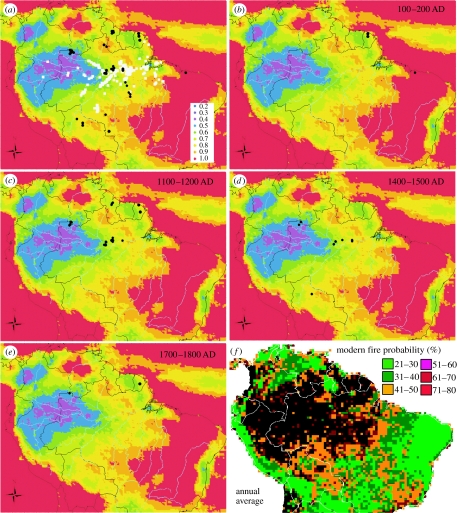
Figure 2.
Spatial and temporal patterns of known fire sites at selected time slices mapped with climate variability. (a) All records, (b) AD 100–200, (c) AD 1100–1200, (d) AD 1400–1500 and (e) AD 1700–1800. Charcoal data are the same as in figure 1 legend. Climate variability of monthly means of precipitation are based on TRMM data 1998–2004 (warmer colours are more variable; Silman 2007). Light grey spots are locations of known terra preta. Black spots represent locations of fires dated to within the time slice. (f) Modern probability of fire (%) occurrence for any given year averaged over 17 years derived from Advanced Very High Resolution Radiometer (AVHRR) satellite observation.

