Figure 4.
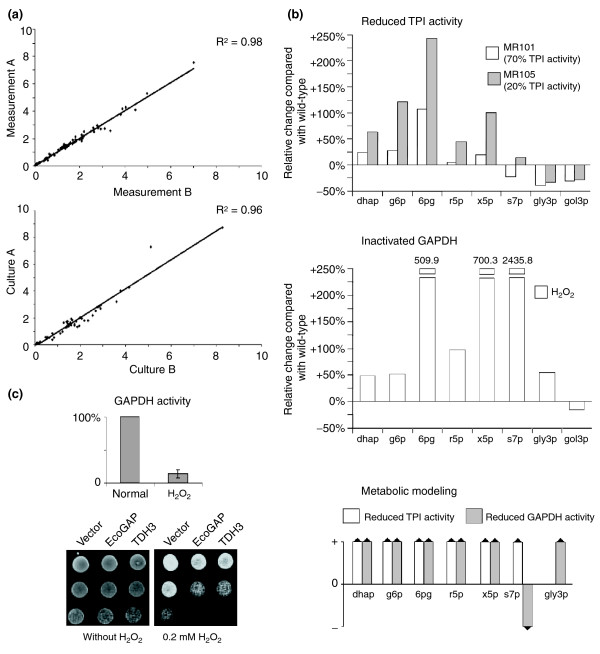
TPI and GAPDH inactivation increases the concentration of PPP metabolites. (a) For quality control of the metabolite quantifications and for analyzing the technical reproducibility, each metabolite was measured in duplicate (top panel). For analyzing the biological reproducibility, the metabolite concentrations were measured from cultures grown in parallel (bottom panel). Please note that for the purpose of illustration values greater than 10 are not shown. The complete plots are presented in Additional data file 3. (b) Upper panel, changes in metabolite levels in yeast strains with differing TPI activity. Lysates of yeast strains BY4741 (100% TPI activity), MR101 (70% TPI activity) and MR105 (20% TPI activity) were prepared and metabolites were quantified by LC-MS/MS. The absolute metabolite concentrations of MR101 and MR105 yeast were normalized and plotted as change given in percent relative to the wild-type (BY4741) strain. Middle panel, changes in metabolite levels in yeast with GAPDH inactivation. Cultures of strain BY4741 were treated with H2O2 or left untreated. The relative changes of the various metabolites of the H2O2-treated cells in comparison to untreated cells were plotted. Bottom panel, predicted qualitative changes in metabolite concentrations using the non-fitted metabolic model. Note that for technical reasons, the abbreviation g6p refers to the sum of glucose-6-phosphate and fructose-6-phosphate and x5p to the sum of xylulose-5-phosphate and ribulose-5-phosphate. (c) Upper panel, GAPDH activity in yeast cells treated with and without H2O2 as in (b). Lower panel, effect of H2O2 on wild-type yeast cells transformed with the 2μ plasmids p423GPD, p423GPD-EcoGAP encoding E. coli GAPDH, or p423GPD-TDH3 encoding the yeast GAPDH Tdh3p. Transformants were selected, grown overnight and the same number of cells were spotted as fivefold serial dilutions on SC-his-ade media supplemented with H2O2 as indicated.

