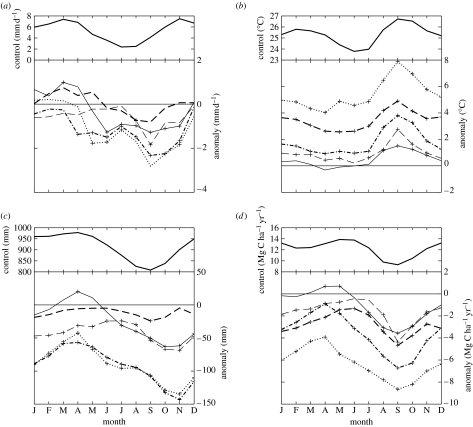
Figure 2.
Simulated monthly mean Amazon Basin (a) rainfall rate (mm d−1) (b) 1.5 m air temperature (°C), (c) total soil moisture content (mm) and (d) NPP (Mg C ha−1 yr−1). Upper panels show CONT climatologies and lower panels show anomalies in each experiment relative to CONT. Thick lines indicate simulations using global SSTAs and thin lines indicate simulations with SSTAs restricted to a tropical basin. Crosses indicate anomalies significant at the 99% level using Student's t-test. Thick line, CONT; dotted line, MWLA; thick dashed line, MW; dash dotted line, LA; thin line, ATL; thin dashed line, PAC.

