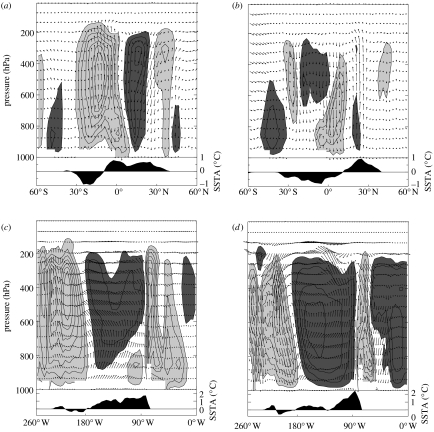
Figure 3.
(Upper panels) Zonal mean atmospheric Hadley circulation (ATL) and anomalies from 70° W to 45° W for (a) SAM months of January to March and (b) dry season months of July to September. Contours show CONT vertical velocity, plotted every 1 Pa s−1; light and dark shadings indicate ascent and descent rates, respectively, of >1 Pa s−1. Arrows show ATL–CONT anomalies in meridional wind–vertical velocity fields. Shaded region shows 65° W to 20° W zonal mean SSTA from ATL using right-hand scale. (Lower panels) Meridional mean atmospheric Walker circulation (PAC) and anomalies from 5° S to 5° N for (c) SAM months of January to March and (d) dry season months of July to September.

