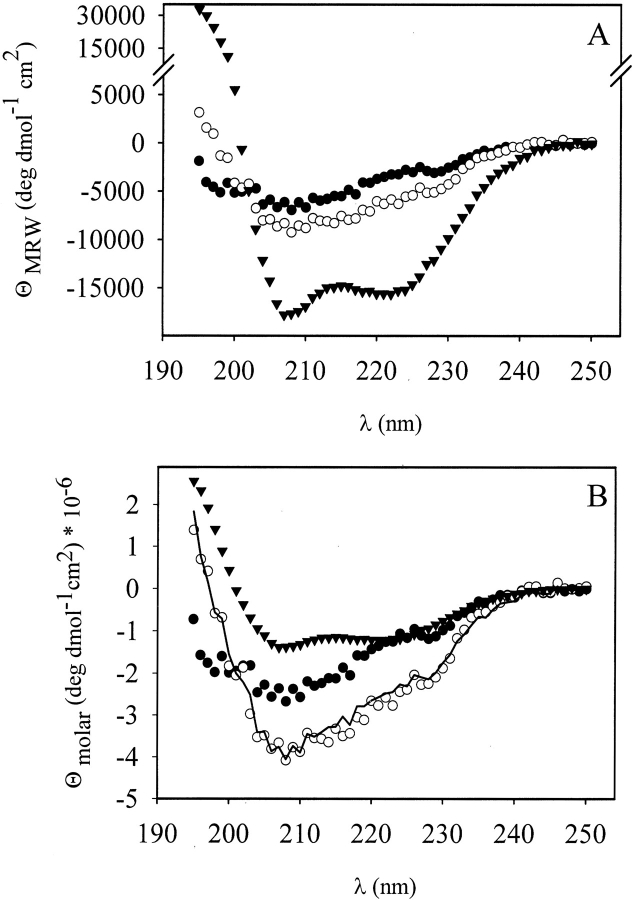
Fig. 3.
Secondary structure of VP1-Z. CD spectra from wtVP1, VP1-Z, and protein Z. VP1 variants were measured in 50 mM Tris at pH 7.4, 200 mM NaCl, 5% (v/v) glycerol, 0.5 mM EDTA, and 1 mM DTT at concentrations of 0.423 mg/mL (wtVP1) and 0.38 mg/mL (VP1-Z), respectively. Protein Z at a protein concentration of 0.15 mg/mL was analyzed in 10 mM Na-phosphate, pH 6.8. (A) Far UV CD spectra of pentameric wtVP1 (filled circle), VP1-Z (open circle) and protein Z (triangles) measured from 250 nm to 195 nm. The CD signals were normalized to ΘMRW. (B) Comparison of the calculated CD spectrum of VP1-Z (solid line), that is the sum of wtVP1 (filled circle) and protein Z (triangles), with the measured spectrum of VP1-Z (open circle). The CD data are normalized to Θmolar.

