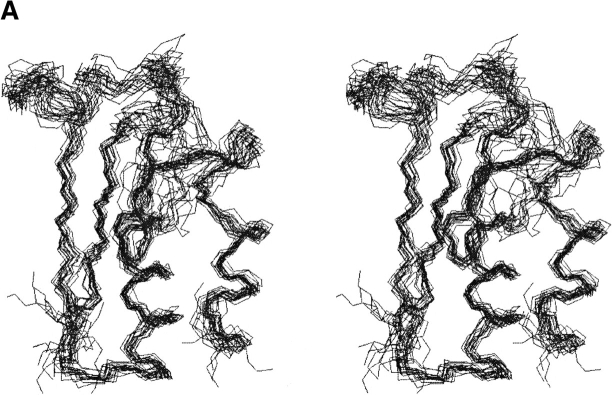
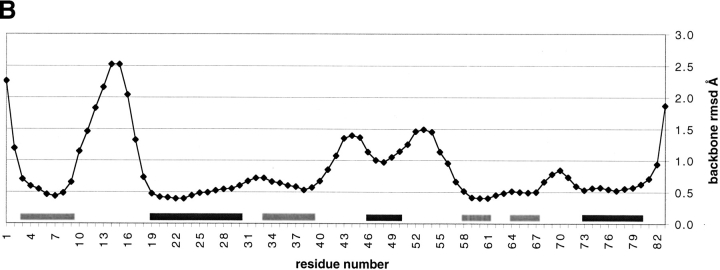
Fig. 6.
(A) A stereoview of the superposition of N, Cα, and C` backbone atoms from the 20 best calculated and refined structures. This figure was created with the program MOLMOL (Koradi et al. 1996). (B) The local RMSD of the backbone atoms is shown as a function of residue number using the superposition shown in A. (light gray bars) Positions of strands; (dark gray bars) helices.


