
Fig. 4.


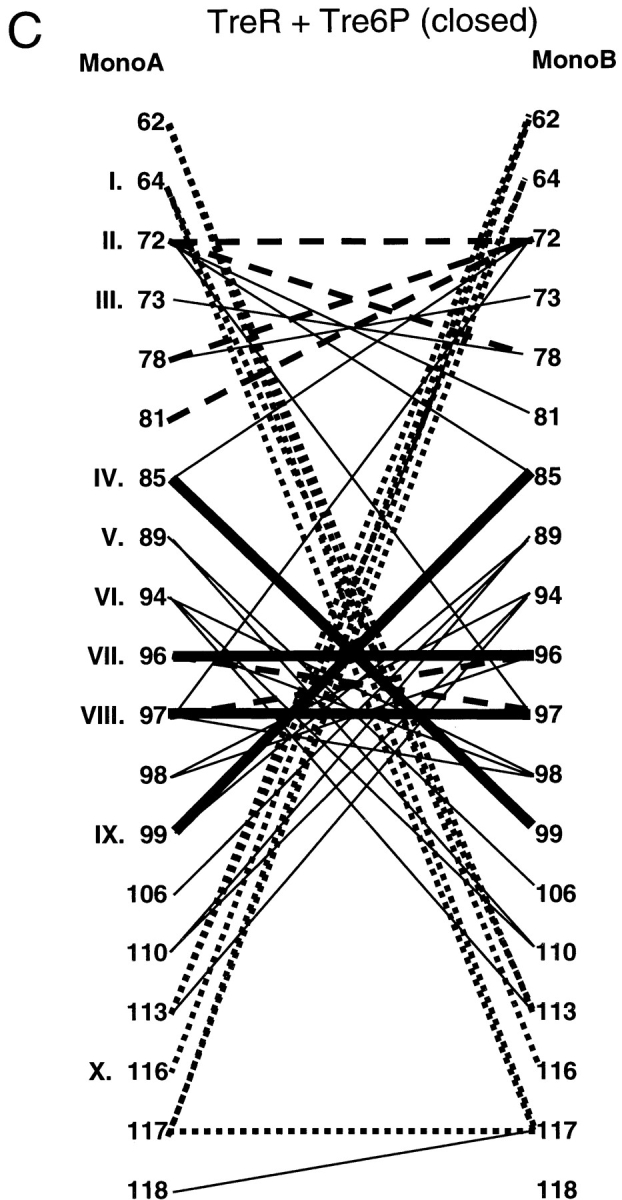


Interface contact maps. Specific interactions of the three repressors are mapped for their core N- and C-interfaces. Proteins and structures used are the same as those used in Figure 3 ▶. Amino acids common to the interfaces of all three proteins are indicated with Roman numerals that correspond to Figure 3 ▶. For LacI and PurR, the left side of the diagram represents the interface of the unliganded open structure, and the right side of the diagram is of the liganded, closed structure. Thick, solid lines represent interactions that are conserved between all three repressors. Dashed lines indicate interactions in common between any two repressors, and the dotted lines depict interactions that have significant similarities between any two proteins. Interactions unique to one repressor are symbolized with thin black lines. These contact maps do not include the cross-subdomain interactions between LacI 74 and 278 and PurR 70 and 278.