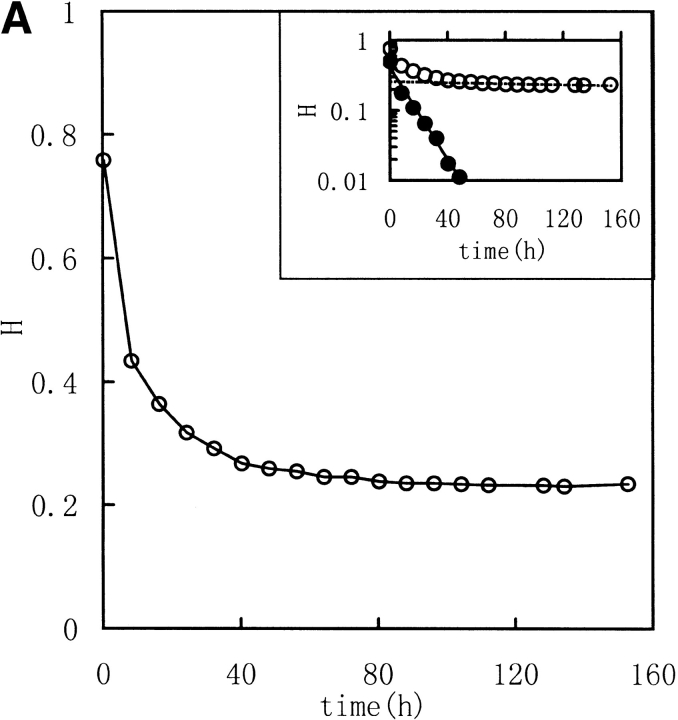
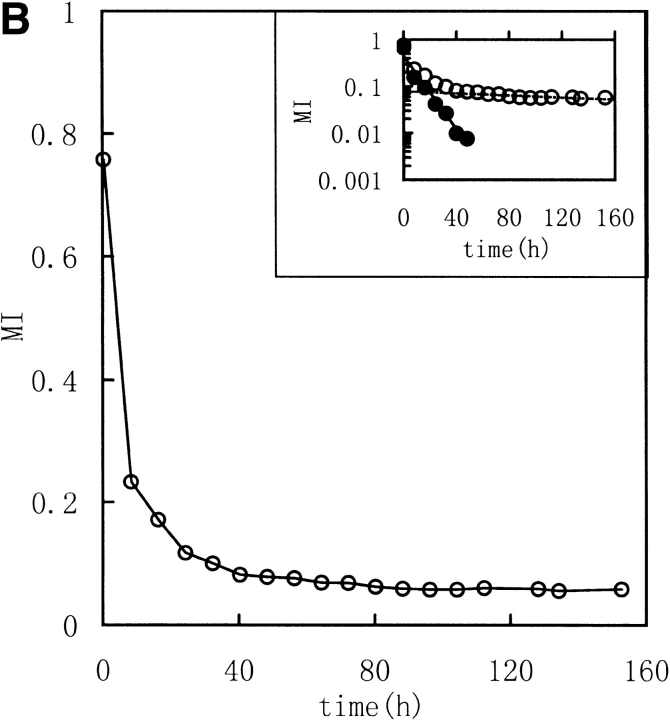
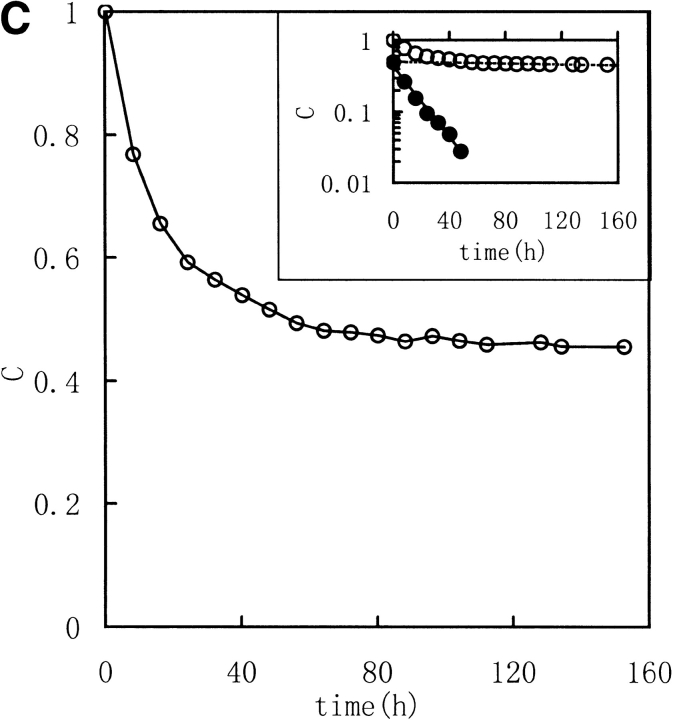
Fig. 3.
Kinetic course of Shannon entropy (A), mutual information (B), and correlation coefficient (C) values of 1H NMR spectra of RNase A during unfolding. Experimental conditions were as for Fig. 2 ▶ except that the temperature was 303K. (Insets) Semilogarithmic plots. (Open circles) Experimental data. (Filled circles) Points obtained by subtracting the contribution of the slow phase from curve (broken lines).


