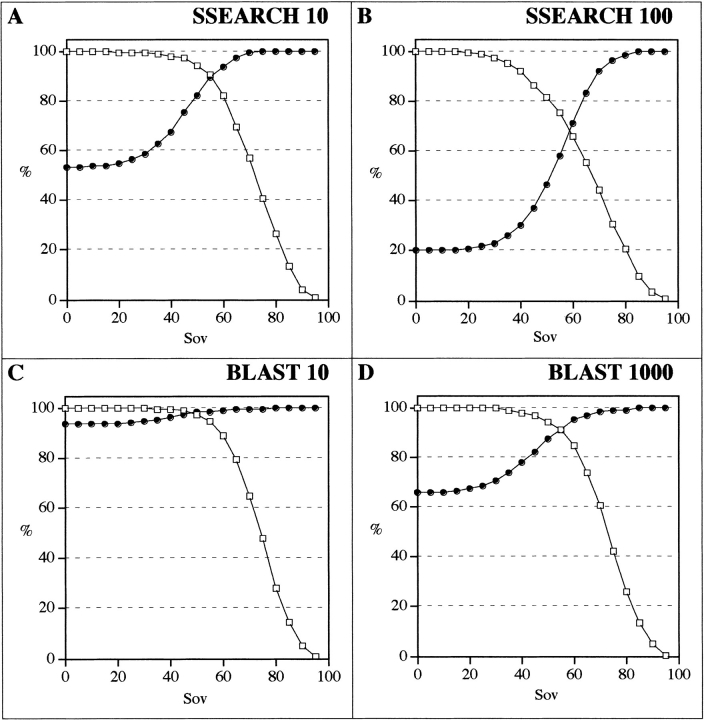
Fig. 7.
Percentages of coverage and detection as a function of predicted secondary structure overlap (Sov). The percentage of coverage (true positive pairs above a given Sov divided by the total number of true positive pairs) is given in open squares. The percentage of detection (true positive pairs divided by total number of pairs above a given Sov) is given in filled circles. The different algorithms used are SSEARCH with E values of 10 (A) and 100 (B) and BLAST with E values of 10 (C) and 1000 (D). Only sequence pairs in the 10%–30% identity range have been taken into account.

