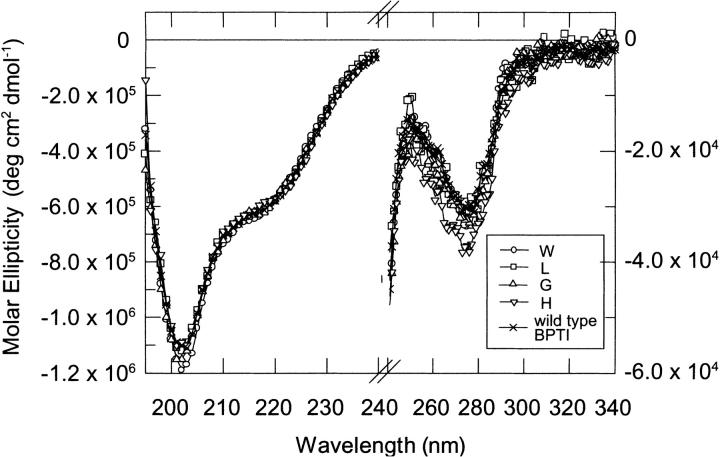
Fig. 2.
Circular dichroism spectra of P1 variants of BPTI in 10 mM formate at pH 2.0 at 298 K. The scans were recorded at 50 nm•min−1 with a step resolution of 1 nm. Each spectrum is the average of five scans. (Left) Spectra recorded in the 195–240 nm range (protein concentration = 3 × 10⁻⁴ M, 1-mm cuvette). (Right) Spectra recorded in the 240–340 nm range (protein concentration = 3 × 10⁻⁵ M, 10-mm cuvette).

