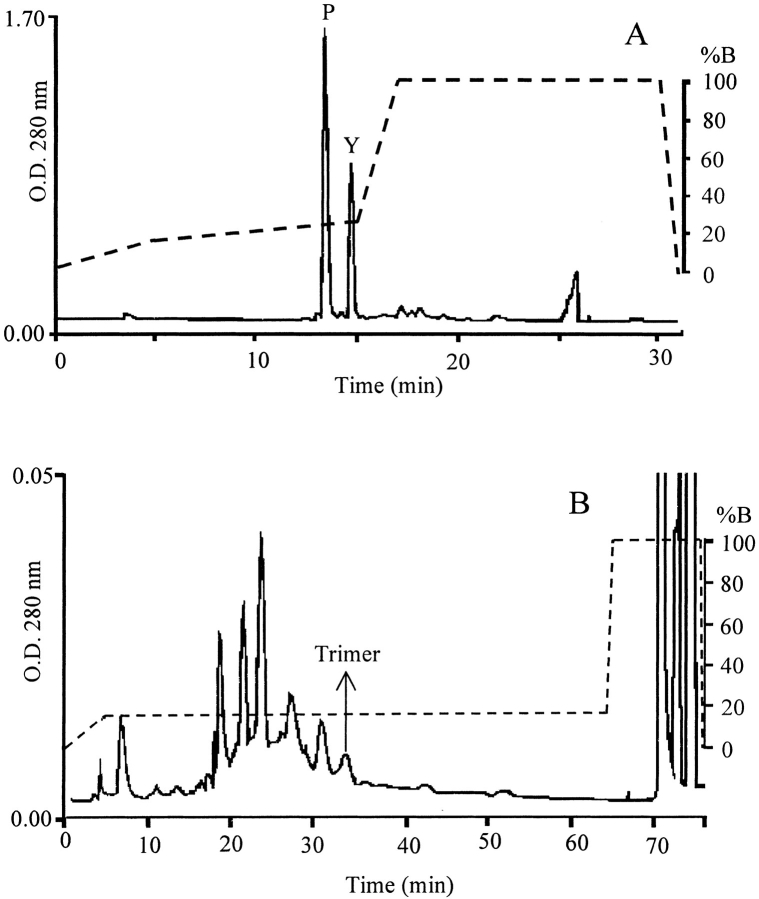
Fig. 4.
HPLC of monomer and oligomer separation (A). HPLC of dimers and trimers (B). Columns and elution profiles (corresponding to the dashed line) are as described in Materials and Methods. Absorbance was measured at 280 nm. In A, P is pink peak and Y is yellow peak. In B, arrow indicates fraction corresponding to the sequenced trimer.

