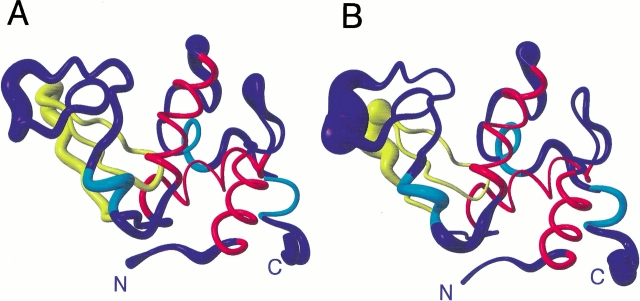
Fig. 5.
Ribbon diagrams showing the mean structures of hen lysozyme from sets 1 (A) and 2 (B). In each case the radius of the ribbon shows the rms difference from the mean for the Cα atoms across the set of 50 structures. Residues 6–15, 25–36 and 89–100, which form the three main α-helices in the protein (helices A, B and C), are shown in red. Three shorter regions of helix are shown in cyan. These correspond to helix D (residues 111–114) and the two 310-helices (residues 81–84 and 120–123) in the X-ray structure. Residues 41–60, which form the triple stranded antiparallel β-sheet in the X-ray structure, are shown in yellow. The N and C termini are labeled. The figure was generated using MOLMOL (Koradi et al. 1996).

