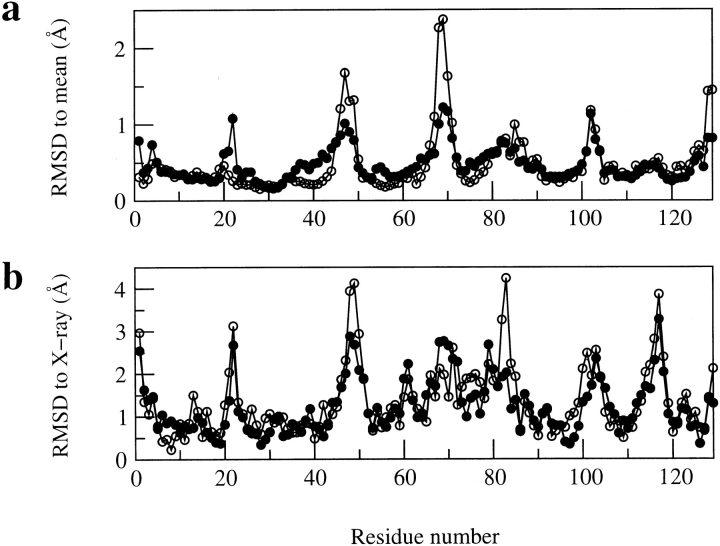
Fig. 6.
Comparison of (a) the average backbone RMSD values (in Å) from the mean structure and (b) the backbone RMSD values (in Å) between the mean structure and the X-ray structure for the ensembles of structures in sets 1 and 2. In each case the RMSD values are shown as a function of residue number, (filled circles) the 50 structures in set 1, calculated including the dipolar coupling data, (open circles) the 50 structures in set 2, calculated without the dipolar coupling data.

