
Fig. 1.
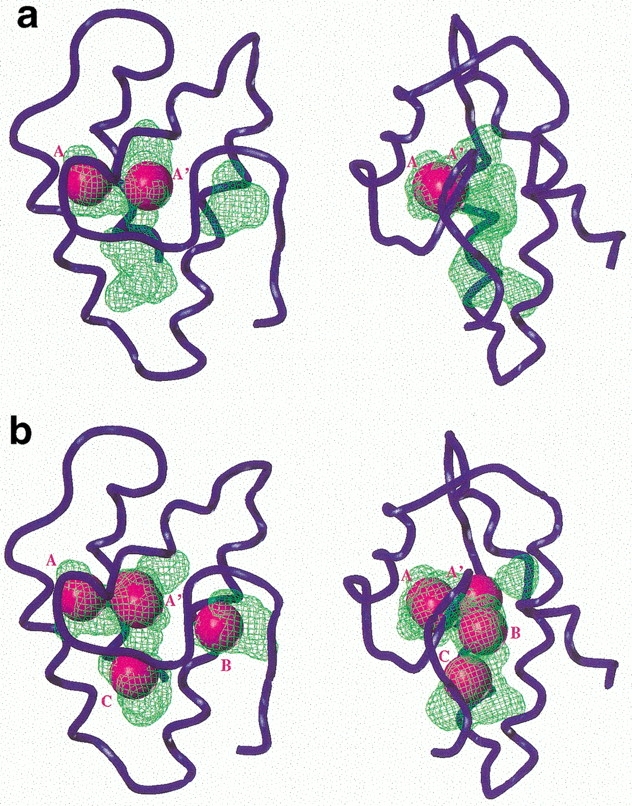
Two representative examples of the solvation simulation of the wheat ns-LTP by xenon. Orthographic views of PDB code 1GH1 model 4 (a) and 2 (b) calculated and represented using the SYBYL software (the same point of view is used for all figures). The protein backbone is shown as a blue tube. The cavity, calculated with the home-written program CAVITE (Gomar et al. 1998), is represented as green volumes. The location of the xenon atoms found by SYBYL are represented by spacefill atoms colored in magenta and named A, A′ B, and C.