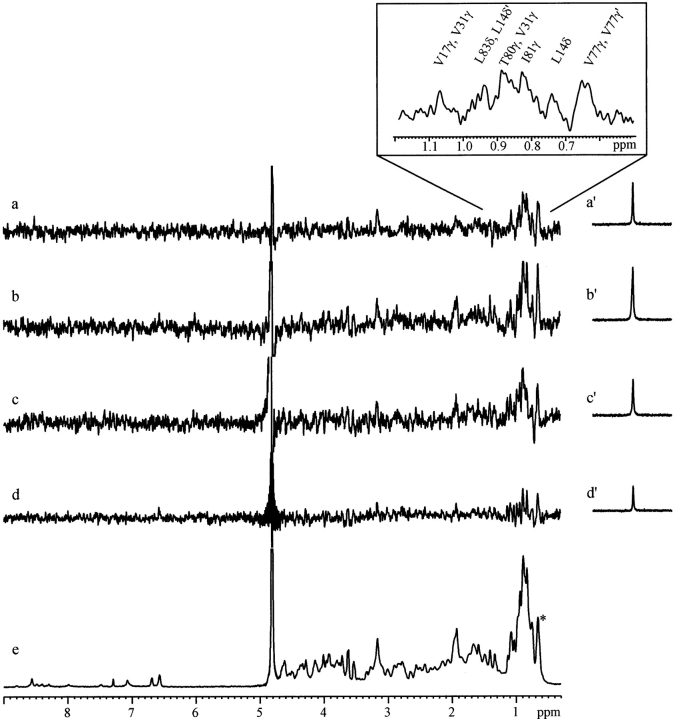
Fig. 3.
(Left) 129Xe → 1H SPINOE spectra of wheat ns-LTP acquired at 600 MHz in D2O for different mixing times (a, 200ms; b, 400ms; c, 600ms; and d 800 ms). On the right (a′–d′), the corresponding 129Xe spectra observed after a small angle flip pulse. The variation of the xenon intensity and the associated proton signal enhancement result from the variable number of spectra added. (e) proton NMR spectrum of the protein. The * indicates γCH3 of Val 75. In insert, subspectrum of (a) with the assignment of unambiguous peaks of this region.

