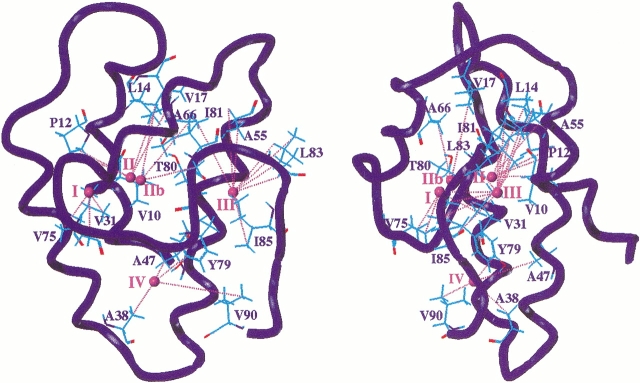
Fig. 4.
Representation of the interaction sites of xenon with wheat ns-LTP as determined by the SPINOE experiments. On the protein backbone (blue tube) is superimposed a representation of residues for which polarization transfer between laser-polarized xenon and protons is observed. Xenon atoms are shown as small magenta spheres that are numbered accordingly to the site number I, II, IIb, III, and IV. The distance restraints used to build the model are displayed as magenta dashed lines. The longest distance restraint in model 2 is the one involving γCH3 of Val90 (8.1 Å), but the same distance = 4 Å using model 6.

