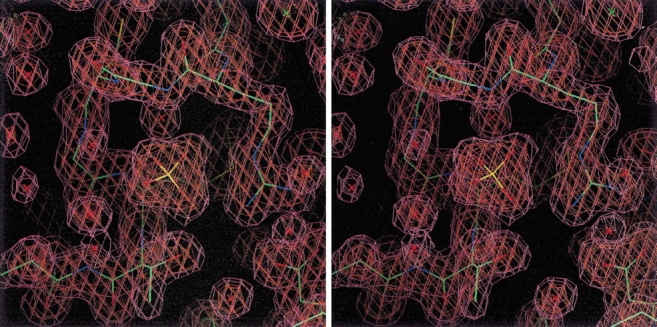
Fig. 3.

A stereo view of a representative section of the final weighted 2F0–Fc map of the K15M mutant of shikimate kinase contoured at 1 and 2 σ above the mean electron density. The region shown corresponds to amino acid residues 9–17 of the P-loop. The bound phosphate ion, water molecules (red crosses), and a chloride ion (green cross) are also shown.
