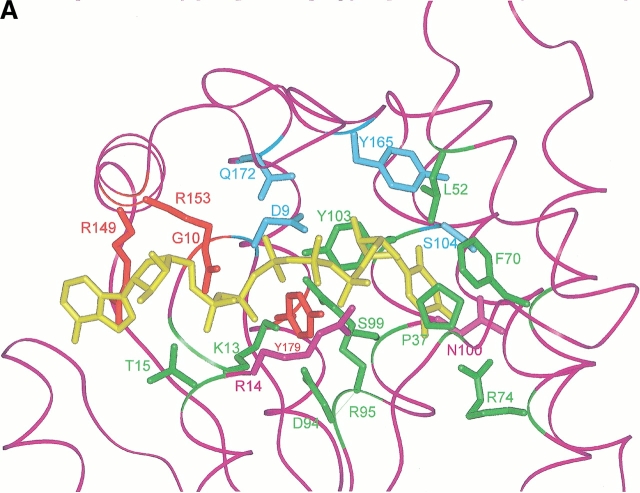
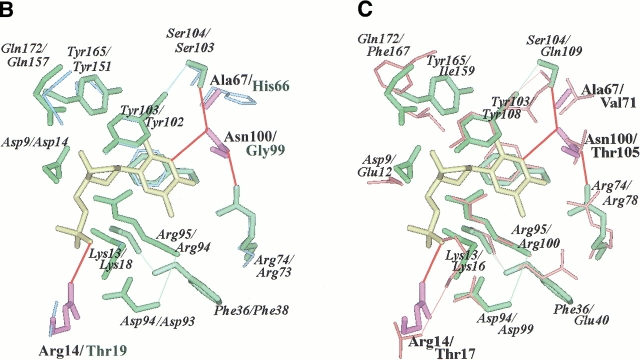
Fig. 2.
(A) Active site of the modeled TMPKmt. The Cα carbone trace is shown as well as the side chain of important residues (discussed in the text). The color code is the same as in figure 1 ▶. The bi-substrate Tp5A [P1–(5′-adenosyl)-P5–(5′-thymidyl)pentaphosphate] is in yellow. Sumperimposed active sites of the modeled TMPKmt and of the available structures (Lavie et al. 1998a, 1998b">b) of TMPKy (B) and of TMPKec (C). dTMP is in yellow. The side chain of important residues for substrate recognition (as discussed in the text) are shown. Residues from TMPKmt that are conserved with TMPKy and TMPKec are in green while those specific of TMPKmt are in violet. All residues from TMPKy are in light blue (B) and those from TMPKec are in red (C). Specific interactions (predicted hydrogen bonds) involving TMPKmt side chains of Arg14, Arg74, Ser103, Asn100, and dTMP are shown as thick red lines.


