
Fig. 5.
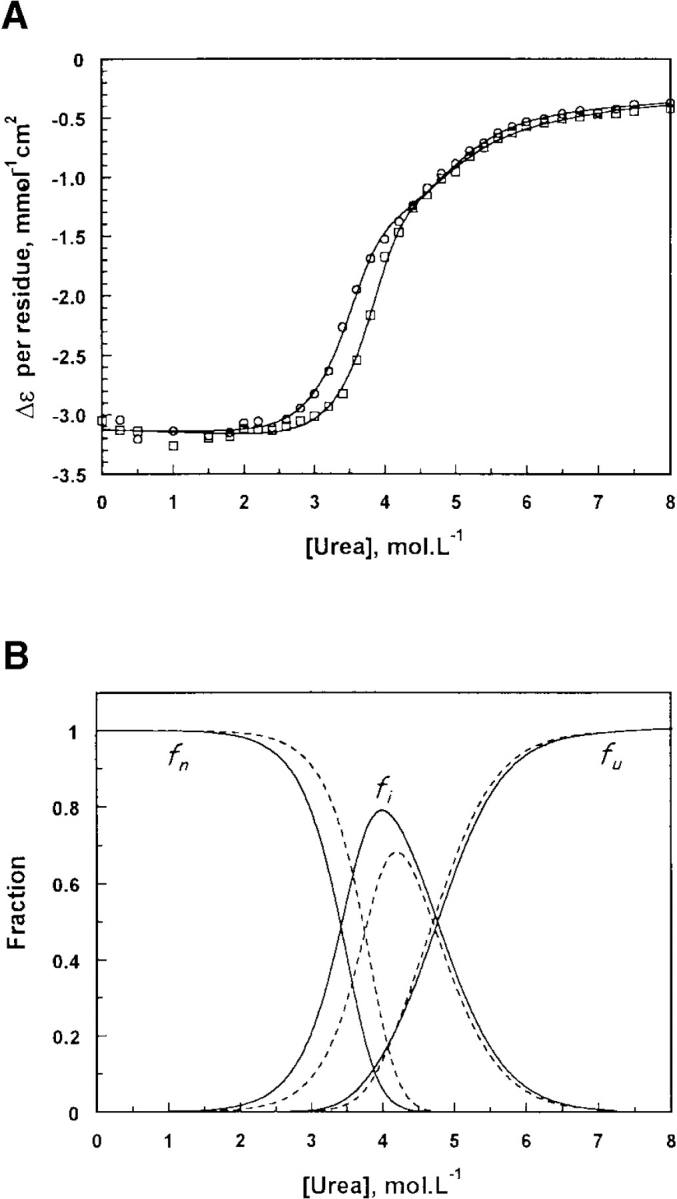
Denaturation of TMPKmt observed by far-ultraviolet circular dichroism. (A) Urea-induced unfolding transition of TMPKmt at 10–6 M (○) and 4.10–6 M (□). 8-M unfolded TMPKmt was diluted to a final concentration of 10–8 M or and 4.10–6 M in solutions containing urea at various concentrations and spectra were recorded after 48 h incubation. The solid lines correspond to the best fit to equation 3 using a nonlinear least square analysis. (B) variation of the native (fn), monomeric intermediate (fi) and unfolded (fu) fractions calculated from the parameters deduced from the individual fit of the two transition curves in (A). Solid line: TMPKmt at 10–6 M. Dotted line: TMPKmt at 4.10–6 M.