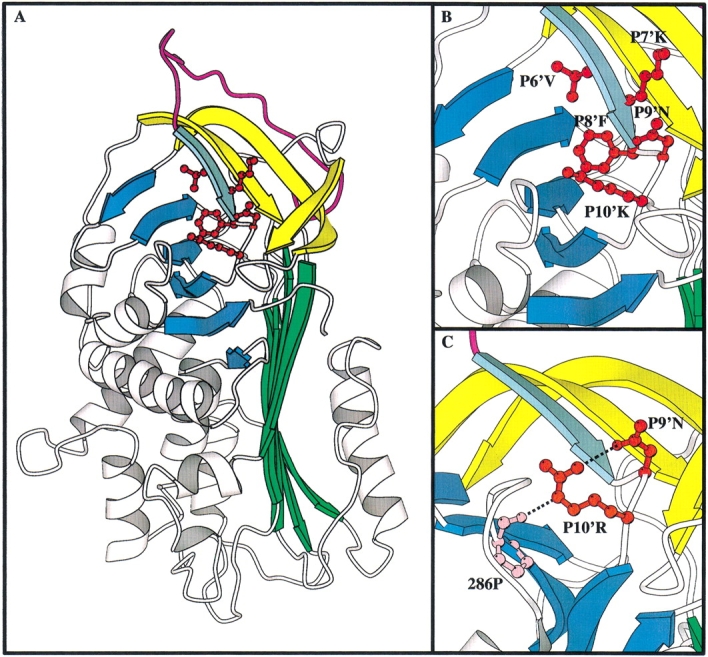
Fig. 1.

Structural diagram of the C β-sheet mutants of α1-antitrypsin in comparison to the equivalent residues in antithrombin. (A) the structure of α1-antitrypsin (pdb identifier 1QLP; Elliot et al. 1996 1998) with the C β-sheet mutations highlighted. The A β-sheet is in green, the B β-sheet in blue, the RCL in magenta, and strands s2C–s4C of the C β-sheet in yellow. Strand s1C is in aquamarine. P6′–P10′ are shown in red ball and stick. (B) Closeup of the C β-sheet region with the side chains of P6′–P10′ labeled. (C) Closeup on the C β-sheet region in antithrombin (pdb identifier 2ANT; Schreuder et al. 1994; Skinner et al. 1997) showing the hydrogen bond network between P10′R, P9′N, and 286P.
