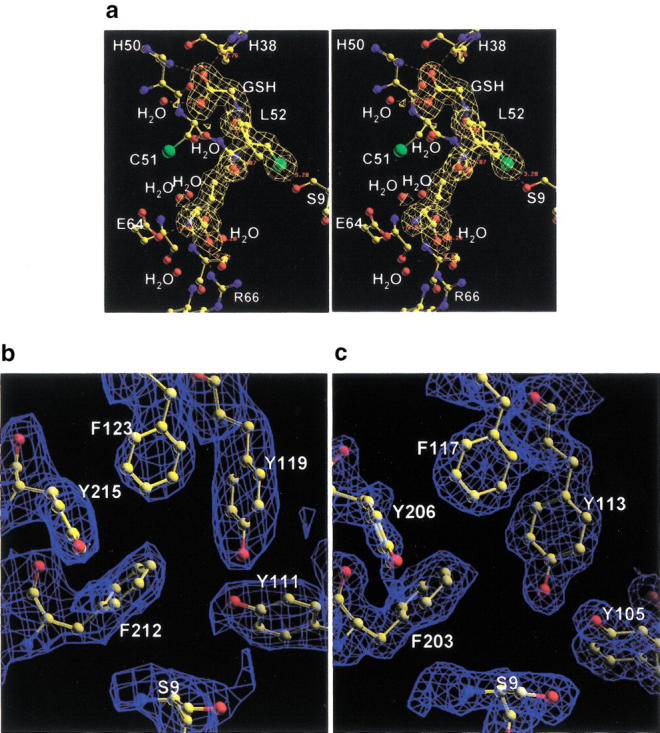
Fig. 1.

(a) Stereo diagram of electron density of GSH in AdGST1–3 (σa-weighted 2fo-fc map shown in gold at a contour of 1σ) with surrounding G-site residues. Electron density of H-site residues for AdGST1–4 (b) and AdGST1–3 (c) with σa-weighted 2fo-fc maps contoured at 1σ are shown in blue. Ball and stick representation is used for all atoms and bonds.
