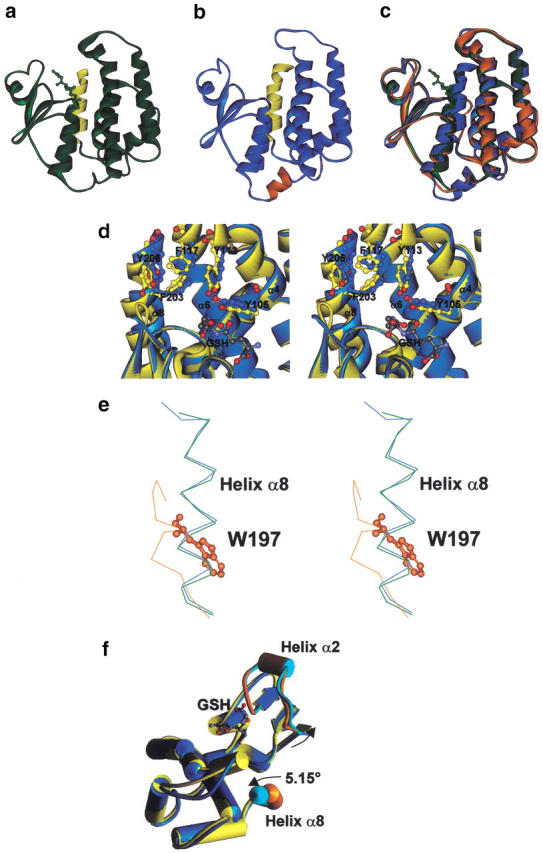
Fig. 2.

Comparison of AdGST1–3, AdGST1–4, and LcGST structures. Monomers of AdGST1–3 (a) and AdGST1–4 (b) are shown in ribbon form with the five-amino-acid insert in AdGST1–4 between the N- and C-terminal domains colored orange. The C-terminal helices (α8) of both enzymes are colored yellow. (c) Superimposed structures of AdGST1–3 (green), AdGST1–4 (blue), and LcGST monomers (orange). (d) Stereo diagram of the H-sites of AdGST1–3 (yellow) and AdGST1–4 (blue). The fold is represented in ribbon form with putative H-site amino acids shown in ball and stick form. The GSH model is of that found in AdGST1–3. Numbers correspond to residues in AdGST1–3. (e) Stereo diagram of superimposed structures of AdGST1–3 (green), AdGST1–4 (blue), and LcGST (orange) in the vicinity of helix α8. The residue W197 in Lucilia GST overlapping helix α8 in AdGST1–3 and AdGST1–4 is indicated in ball-and-stick form. (f) Comparison of AdGST 1–3 (yellow) versus AdGST1–4 (blue) with helices shown as cylinders. Helix α8 and the region around and including helix α2 is highlighted in orange (for AdGST1–3) and cyan (for AdGST1–4). The shifts in AdGST1–4 relative to AdGST1–3 are indicated.
