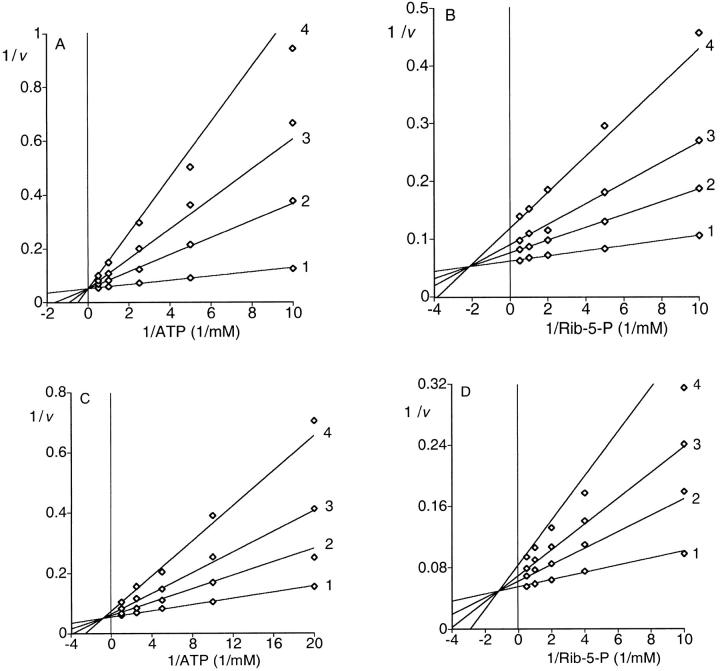
Fig. 3.
Product inhibition of PRPP synthase. Activity was determined as described in Materials and Methods. The concentration of MgCl2 was 5.0 mM. (A) Double-reciprocal plot of initial velocity versus ATP at four concentrations of PRPP. The concentration of Rib-5-P was 1.0 mM. The concentration of ATP was varied from 0.1 to 2.0 mM in the presence of different concentrations of PRPP: 1, 0.0 mM; 2, 0.5 mM; 3, 1.0 mM and 4, 2.0 mM. The lines represent fitting of the data set to Equation 2. (B) Double-reciprocal plot of initial velocity versus Rib-5-P at four concentrations of PRPP. The concentration of ATP was 1.0 mM. The concentration of Rib-5-P was varied from 0.1 to 2.0 mM in the presence of different concentrations of PRPP: 1, 0.0 mM; 2, 0.5 mM; 3, 1.0 mM and 4, 2.0 mM. The lines represent fitting of the data set to Equation 3. (C) Double-reciprocal plot of initial velocity versus ATP at four concentrations of AMP. The concentration of Rib-5-P was 1.0 mM. The concentration of ATP was varied from 0.05 to 1.0 mM in the presence of different concentrations of AMP: 1, 0.0 mM; 2, 0.5 mM; 3, 1.0 mM and 4, 2.0 mM. The lines represent fitting of the data set to Equation 3. (D) Double-reciprocal plot of initial velocity versus Rib-5-P at four concentrations of AMP. The concentration of ATP was 2.0 mM. The concentration of Rib-5-P was varied from 0.1 to 2.0 mM in the presence of different concentrations of AMP: 1, 0.0 mM; 2, 0.5 mM; 3, 1.0 mM and 4, 2.0 mM. The lines represent fitting of the data set to Equation 3.

