
Fig. 4.
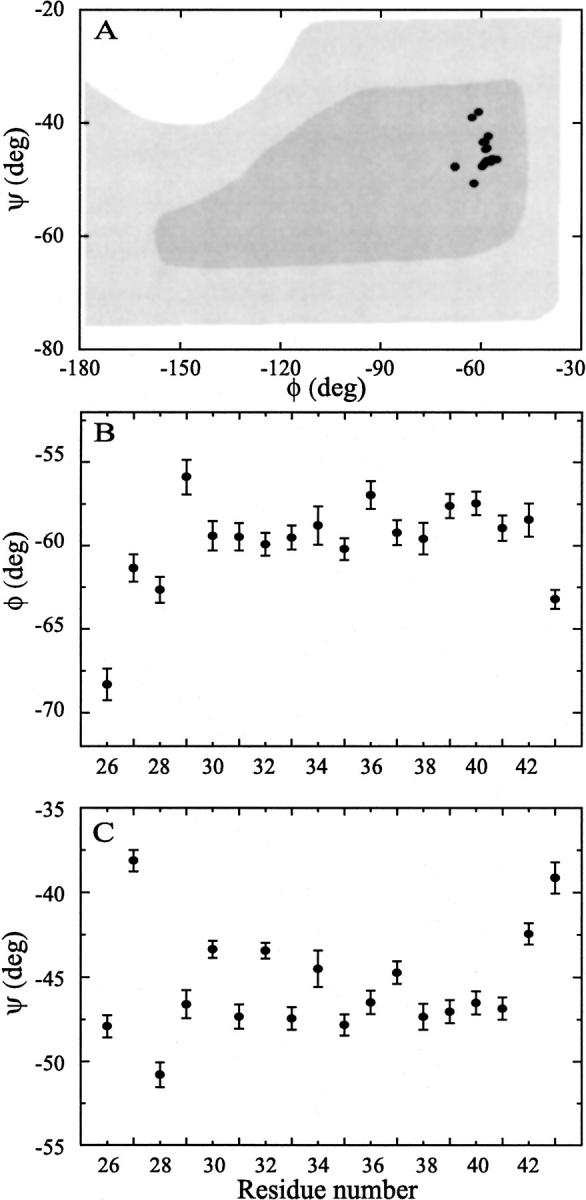
(A) On refinement of the M2-TMP helix a small but significant dispersion in both φ and ξ angles is observed within the α-helical region of the Rhamachandran diagram (here adapted from Voet and Voet (1990)). (B) φ distribution for each of the resonances in the sequence 26–43 contained within M2-TMP. Note that residue 25 is a proline. The distribution for each residue is obtained from a set of 30 refinements. (C) ξ distribution as for the φ in B. Note that the individual residue distributions are small compared to the distribution of angles for the various residues.