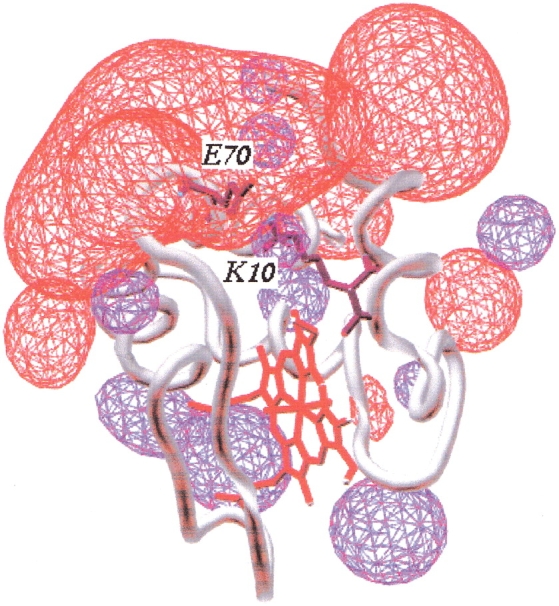
Fig. 1.

Schematic model of the three-dimensional structure of cytochrome c551. Electrostatic potential is calculated at pH 7.0 and ionic strength at 0.1 M. The red and blue contours represent the negative and the positive electric fields, respectively. The electrostatic potential was calculated by using gromos96 in the SPDBV package software. It is evident that the E70–K10 salt bridge (represented in black) is located at the bottom of an extensive negative field.
