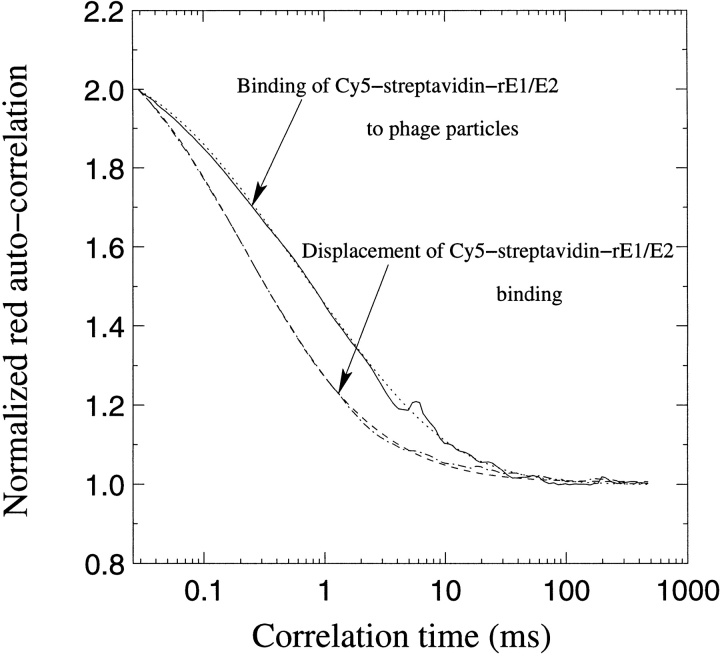
Fig. 3.
Fluorescence Correlation Spectroscopy curves for interactions between phage and rE1/E2 protein with free Cy5, binding and displacement. The biotinylated rE1/E2 was labeled with Cy5–streptavidin. The concentrations used were 237 nM phage and 28 nM rE1/E2–Cy5 antigen. The displacement was performed using 222 nM free antigen and analyzed after 2 hr.

