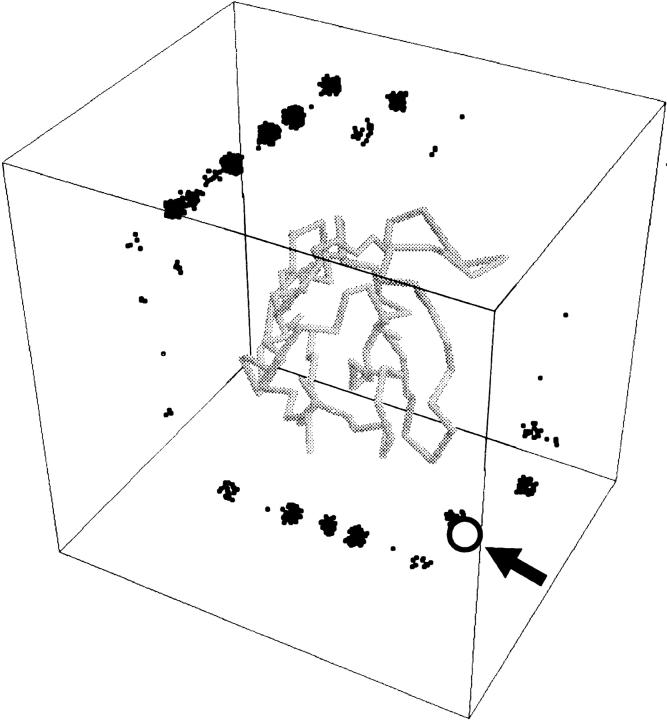
Fig. 7.
Example of the distribution of matches around the receptor. The receptor is 1wtl, subunit B, and the ligand is 1wtl, subunit A. The CM of the ligand is shown as a black dot, for 1000 lowest-energy positions of the ligand. The open circle (indicated by an arrow) is the actual position of the ligand's CM within the complex. The distribution of the matches reflects clustering on an ∼7-Å grid. Multiple ligand positions in the same grid node occur due to the multiplicity of ligand angular orientations at low resolution (Vakser 1995). For better visualization, matches in the same grid node were randomly shifted by a small interval.

