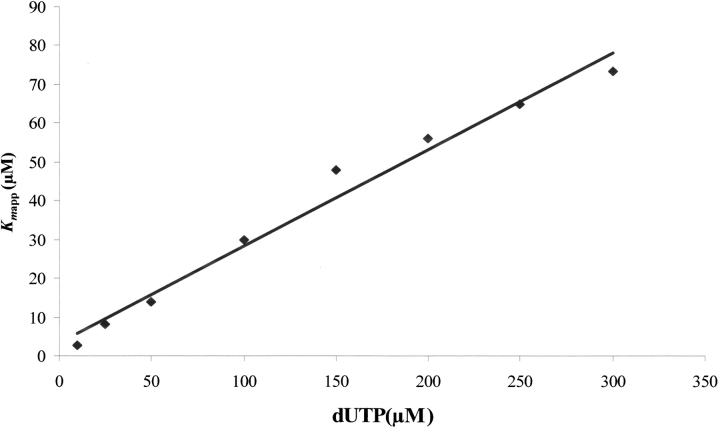
Fig. 2.
Replot of Kmapp vs. [S0]. Replot of the different slope values (Kmapp) from the linear plots of the inset of Figure 1 ▶, at different substrate concentrations from 10 to 300 μM, vs. [S]0. Following the integrated Michaelis–Menten equation for enzymes with product inhibition, the Kip value and the real Km could be obtained from this new linear replot as described in Materials and Methods.

