Fig. 3.
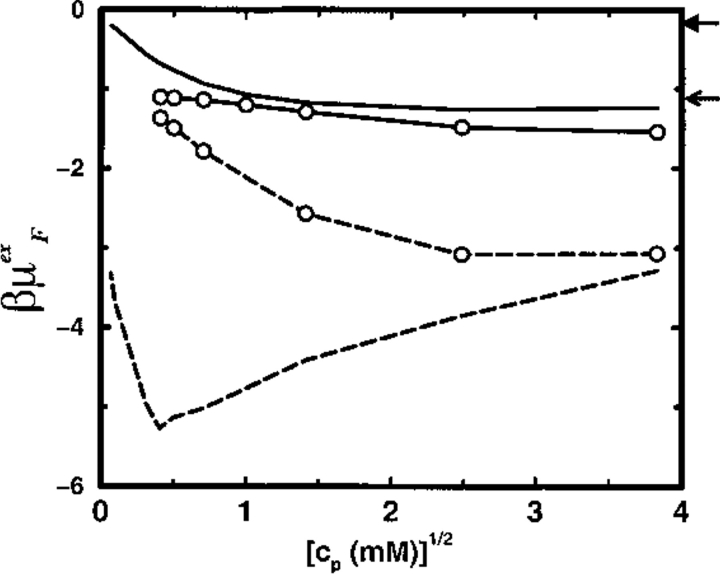
The reduced excess chemical potential for a divalent cation as a function of protein concentration with a homogeneous dielectric response (dielectric radius Rd = 0). The solid lines refer to the SC8 model and the broken lines to the SC24 model. Lines marked by circles denote a monovalent simple electrolyte concentration of cs = 100 mM; lines without symbols are for cs = 1 mM. The arrows indicate the value of βμFex in the corresponding bulk salt solutions. The upper arrow indicates the system at cs = 1 mM (βμFex = −0.156).

